- Reference >
- Monitoring Agent >
- Install Monitoring Agent >
- Install or Update the Monitoring Agent on Windows
Install or Update the Monitoring Agent on Windows
On this page
Overview
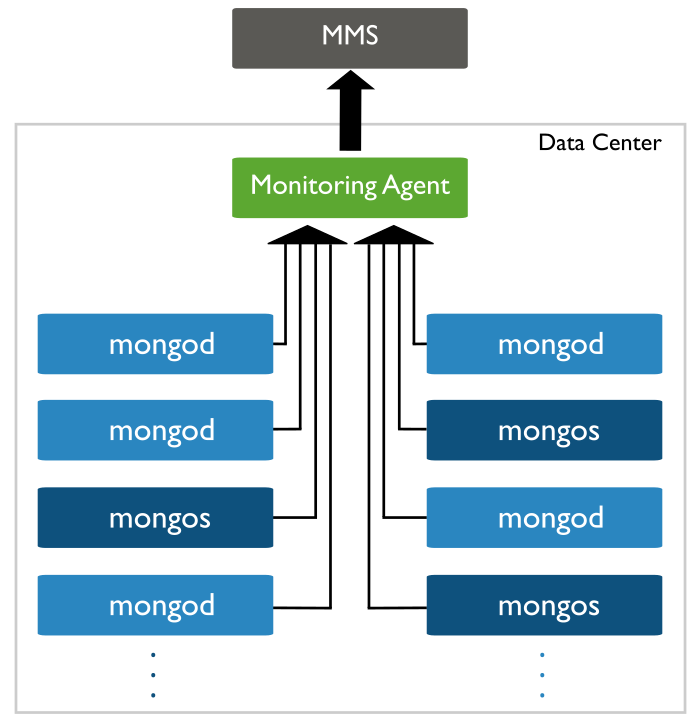
The Ops Manager Monitoring Agent is a lightweight component that runs within your infrastructure, connects to your MongoDB processes, collects data about the state of your deployment, and then sends the data to the Monitoring service which processes and renders this data. The agent initiates all connections to the Monitoring service, and communications between the agent and the Monitoring service are encrypted. A single agent can collect data from multiple MongoDB processes.
Consider the following diagram of an example deployment:
This tutorial will guide you through the steps necessary to install or update Monitoring on your system. You must install the Ops Manager Monitoring server itself before installing the Monitoring Agent.
See Monitoring FAQs for additional information.
Considerations
Connectivity
You must configure the networking rules of your deployment so that:
- the Monitoring Agent can connect to all mongod and mongos instances that you want to monitor.
- the Monitoring Agent can connect to Monitoring server on port 443
(i.e.
https.)
The Monitoring server does not make any outbound connections to the agents or to MongoDB instances. If Exposed DB Host Check is enabled, the Monitoring server will attempt to connect to your servers occasionally as part of a vulnerability check.
Ensure all mongod and mongos instances are not accessible to hosts outside your deployment.
Monitoring Agent Redundancy
A single Monitoring Agent is sufficient and strongly recommended. However, you can run additional instances of the agent as hot standbys to provide redundancy. If the primary agent fails, a standby agent starts monitoring.
When you run multiple agents, only one Monitoring Agent per group or environment is the primary agent. The primary agent reports the cluster’s status to Ops Manager. The remaining agents are completely idle, except to log their status as standby agents and to periodically ask Ops Manager whether they should become the primary.
To install additional agents, simply repeat the installation process.
Collection Interval
If you are updating the agent, keep in mind that when the Monitoring Agent restarts, there is a five-minute delay before that agent begins collecting data and sending pings to Monitoring. If you have multiple agents, this delay permits other agents in your infrastructure to become the primary agent and permits Monitoring to determine which agent will be primary.
During this interval, the restarted Monitoring Agent will not collect data.
Prerequisites
If your MongoDB deployment enforces access control, you must create a user in MongoDB with the appropriate access. See Configure Monitoring Agent for Access Control.
Procedures
This section includes procedures for both installing and updating the Monitoring Agent.
Install the Monitoring Agent on Windows
Use this procedure to install the agent on Windows.
Download and run the latest version of the Monitoring Agent MSI file.
Download and run the 32-bit or 64-bit MSI file. During installation, the installer prompts you to specify the folder for storing configuration and log files. It is strongly advised that you encrypt or restrict access to this folder.
To download the 32-bit MSI file, use the following URL, where
<mms-server> is the hostname of the Monitoring server:
To download the 64-bit MSI file, use the following URL, where
<mms-server> is the hostname of the Monitoring server:
During installation, the installer prompts you to specify the folder for storing configuration and log files. It is strongly advised that you encrypt or restrict access to this folder.
Retrieve the Ops Manager API key for your Ops Manager group.
In the Administration tab on the Agents page, click the link for your operating system. Ops Manager will then display a procedure that includes a step to set your Ops Manager API key. The step displays the actual Ops Manager API key used by your Ops Manager group. Copy the key.
Edit the monitoring-agent.config file to include your Ops Manager API key.
In the <install-directory>/monitoring-agent.config file, set the
mmsApiKey property to your API key.
The default location for the agent configuration file is
C:\MMSData\Monitoring\monitoring-agent.config.
Edit the monitoring-agent.config file to include the hostname of the Monitoring server.
Set the mmsBaseUrl property to the hostname of the Monitoring server.
Start the Monitoring Agent.
Issue the following command:
In Windows Control Panel, open Administrative Tools, and then
open Services.
In the list of services, select the Ops Manager Monitoring Agent service.
Select the Action menu and select Start.
Remember, that you only need to run 1 Monitoring Agent for each Ops Manager group. A single Monitoring Agent can collect data from many MongoDB instances.
Update the Monitoring Agent on Windows
To update the agent on Windows systems:
Stop any currently running Monitoring Agents.
In Windows Control Panel, open Administrative Tools and then
Services.
In the list of services, select the Ops Manager Monitoring Agent service. Select the
Action menu and select Stop.
Download and run the latest version of the Monitoring Agent MSI file.
Download and run the 32-bit or 64-bit MSI file. During installation, the installer prompts you to specify the folder for storing configuration and log files. It is strongly advised that you encrypt or restrict access to this folder.
To download the 32-bit MSI file, use the following URL, where
<mms-server> is the hostname of the Monitoring server:
To download the 64-bit MSI file, use the following URL, where
<mms-server> is the hostname of the Monitoring server:
During installation, the installer prompts you to specify the folder for storing configuration and log files. It is strongly advised that you encrypt or restrict access to this folder.
Retrieve the Ops Manager API key for your Ops Manager group.
In the Administration tab on the Agents page, click the link for your operating system. Ops Manager will then display a procedure that includes a step to set your Ops Manager API key. The step displays the actual Ops Manager API key used by your Ops Manager group. Copy the key.
Edit the monitoring-agent.config file to include your Ops Manager API key.
In the <install-directory>/monitoring-agent.config file, set the
mmsApiKey property to your API key.
Start the Monitoring Agent.
In Windows Control Panel, open Administrative Tools, and then
open Services.
In the list of services, select the Ops Manager Monitoring Agent service. Select
the Action menu and select Start.
Remember, that you only need to run 1 Monitoring Agent for each Ops Manager group. A single Monitoring Agent can collect data from many MongoDB instances.